What Does it Look Like?
Click on the images below to enlarge them and see more detail.
Main page

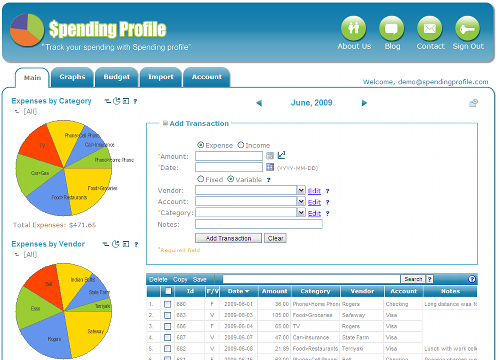
The main page shows all transactions for the selected time period. Pie charts give your spending breakdown by category and vendor. You can add new transactions, update existing transactions, add new categories, or select a different time period to view. The balance of your income and expenses appears at the bottom of the page.
Click on the image to enlarge it and see descriptions of each area.
Budget Page

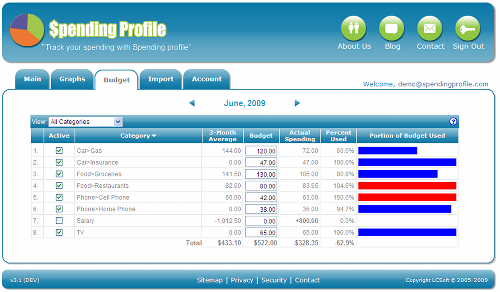
Create a monthy budget and compare it to your actual spending.
Graphs page

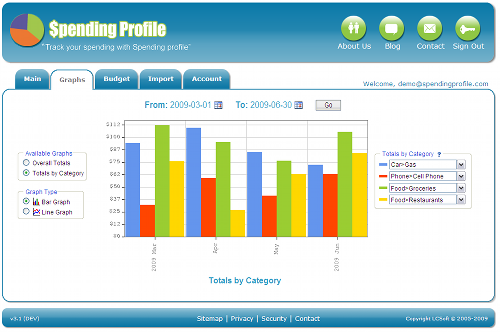
Bar and line graphs show your spending habits over time. View your overall totals, and your totals by category. It`s easy spot trends in your spending!
Totals Graph: Shows your totals over all categories. Also shows the totals for all fixed and variable transactions.
Categories Graph: Shows your totals by category over time. Pick the categories you wish to display.You can pick the start and end dates of the time period you wish to display.
Import Transactions

Import transactions from your bank account or credit card.


